This sections produces all the figures used in Supplementary Figure 9.
# Source setup file
source("./functions/setup.R")

# Load functions
source("./functions/plotProfile.R")
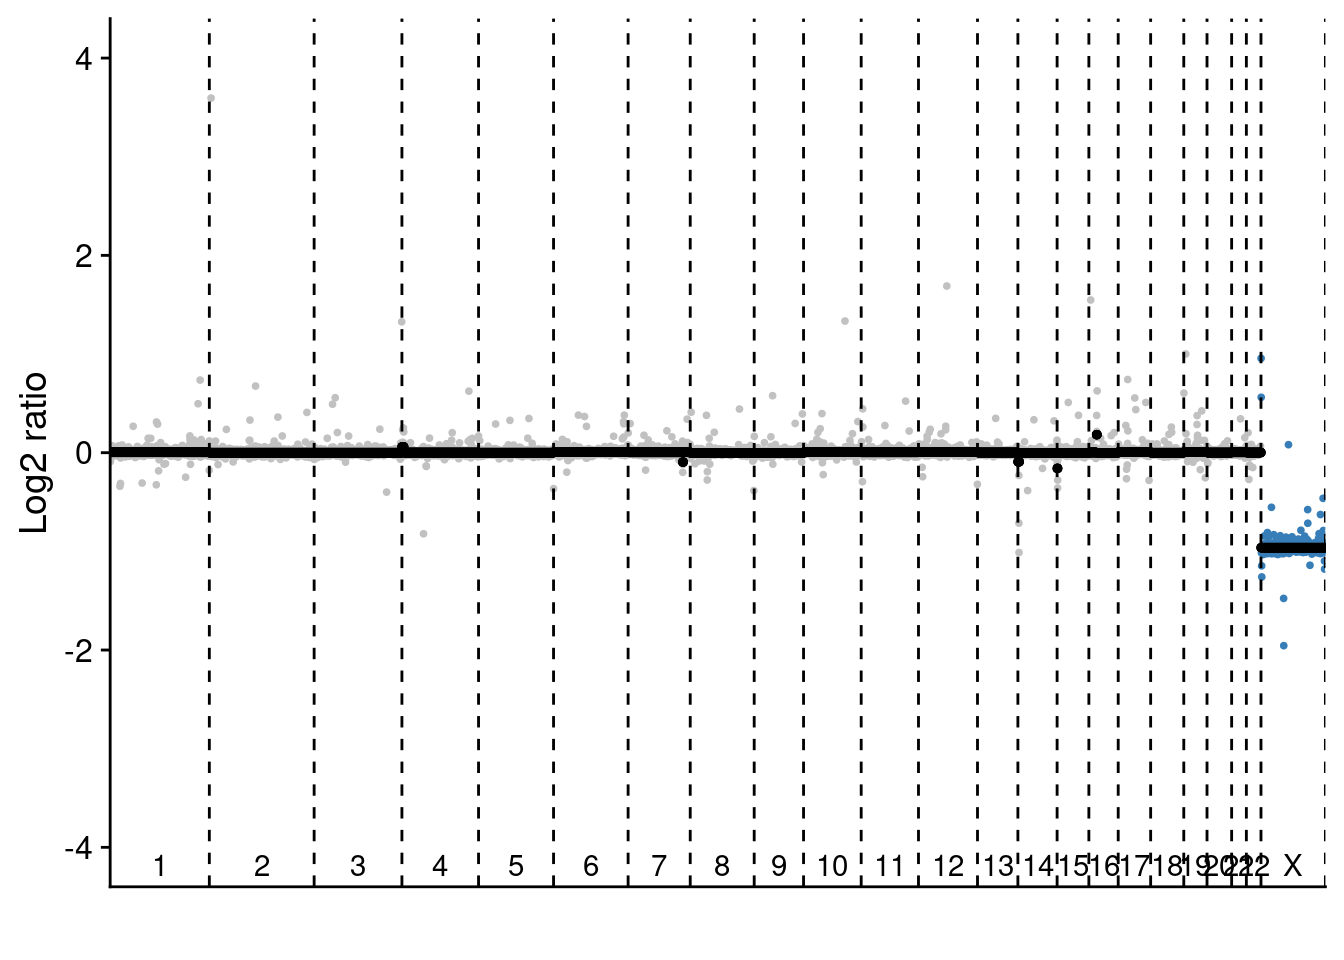
# Load data
cnv = readRDS("./data/blood_wgs_cnv.rds")

# Plot profiles
# P3
plotProfile(cnv$segments[[1]], cnv$counts_lrr[[1]], bins = cnv$bins, sc = FALSE)
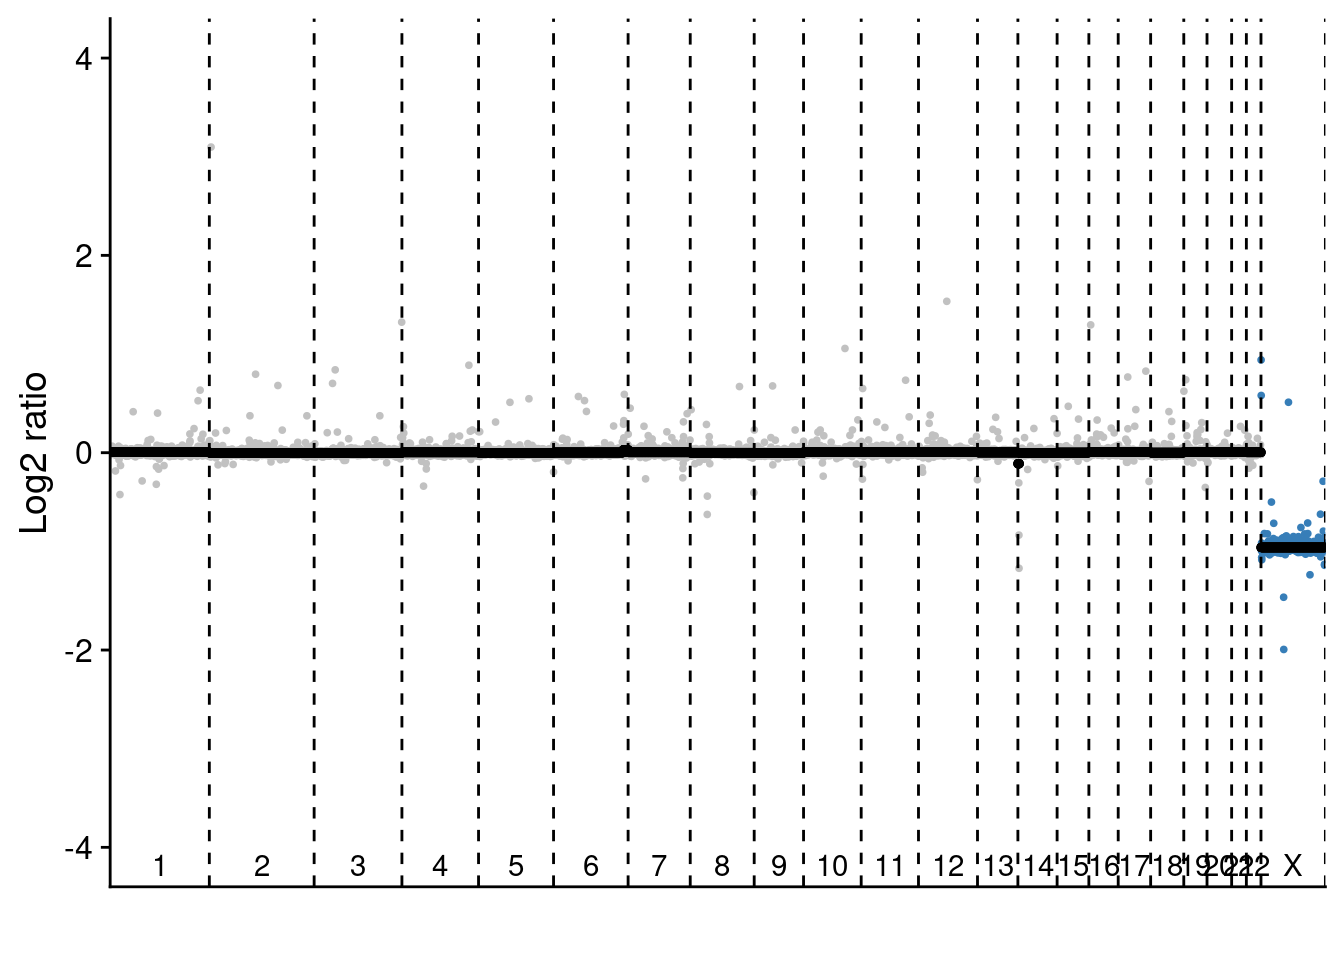
# P6
plotProfile(cnv$segments[[2]], cnv$counts_lrr[[2]], bins = cnv$bins, sc = FALSE)