17 Validation of pseudodiploid deletions
This sections produces all the figures used in Figure 3.
# Source setup file
source("./functions/setup.R")

# Load functions
source("./functions/plotHeatmap.R")
# Load in data
ACT = readRDS("./data/CD1p.rds")
scCUTseq = readRDS("./data/CD27.rds")
# Plot heatmaps
# scCUTseq
plotHeatmap(scCUTseq$copynumber[, scCUTseq$stats[classifier_prediction == "good", sample], with = F], scCUTseq$bins, linesize = 1.6)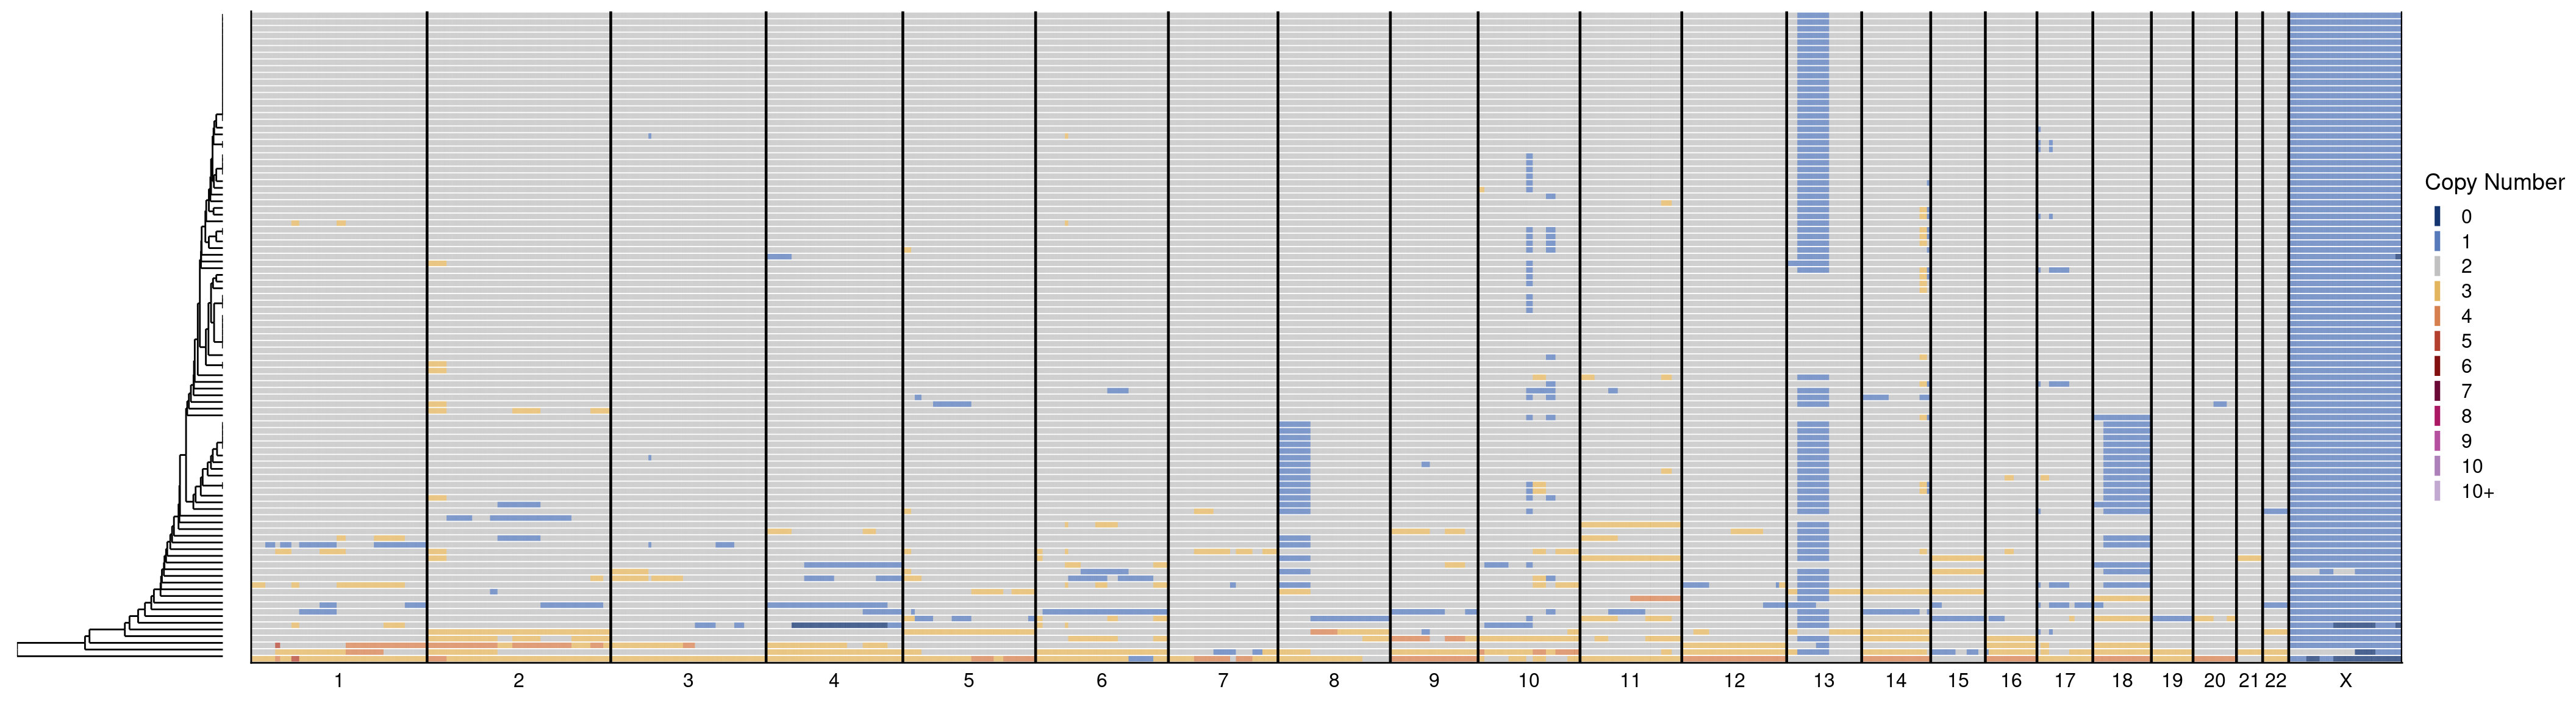
# ACT
plotHeatmap(ACT$copynumber[, ACT$stats[classifier_prediction == "good", sample], with = F], ACT$bins, linesize = 1.6)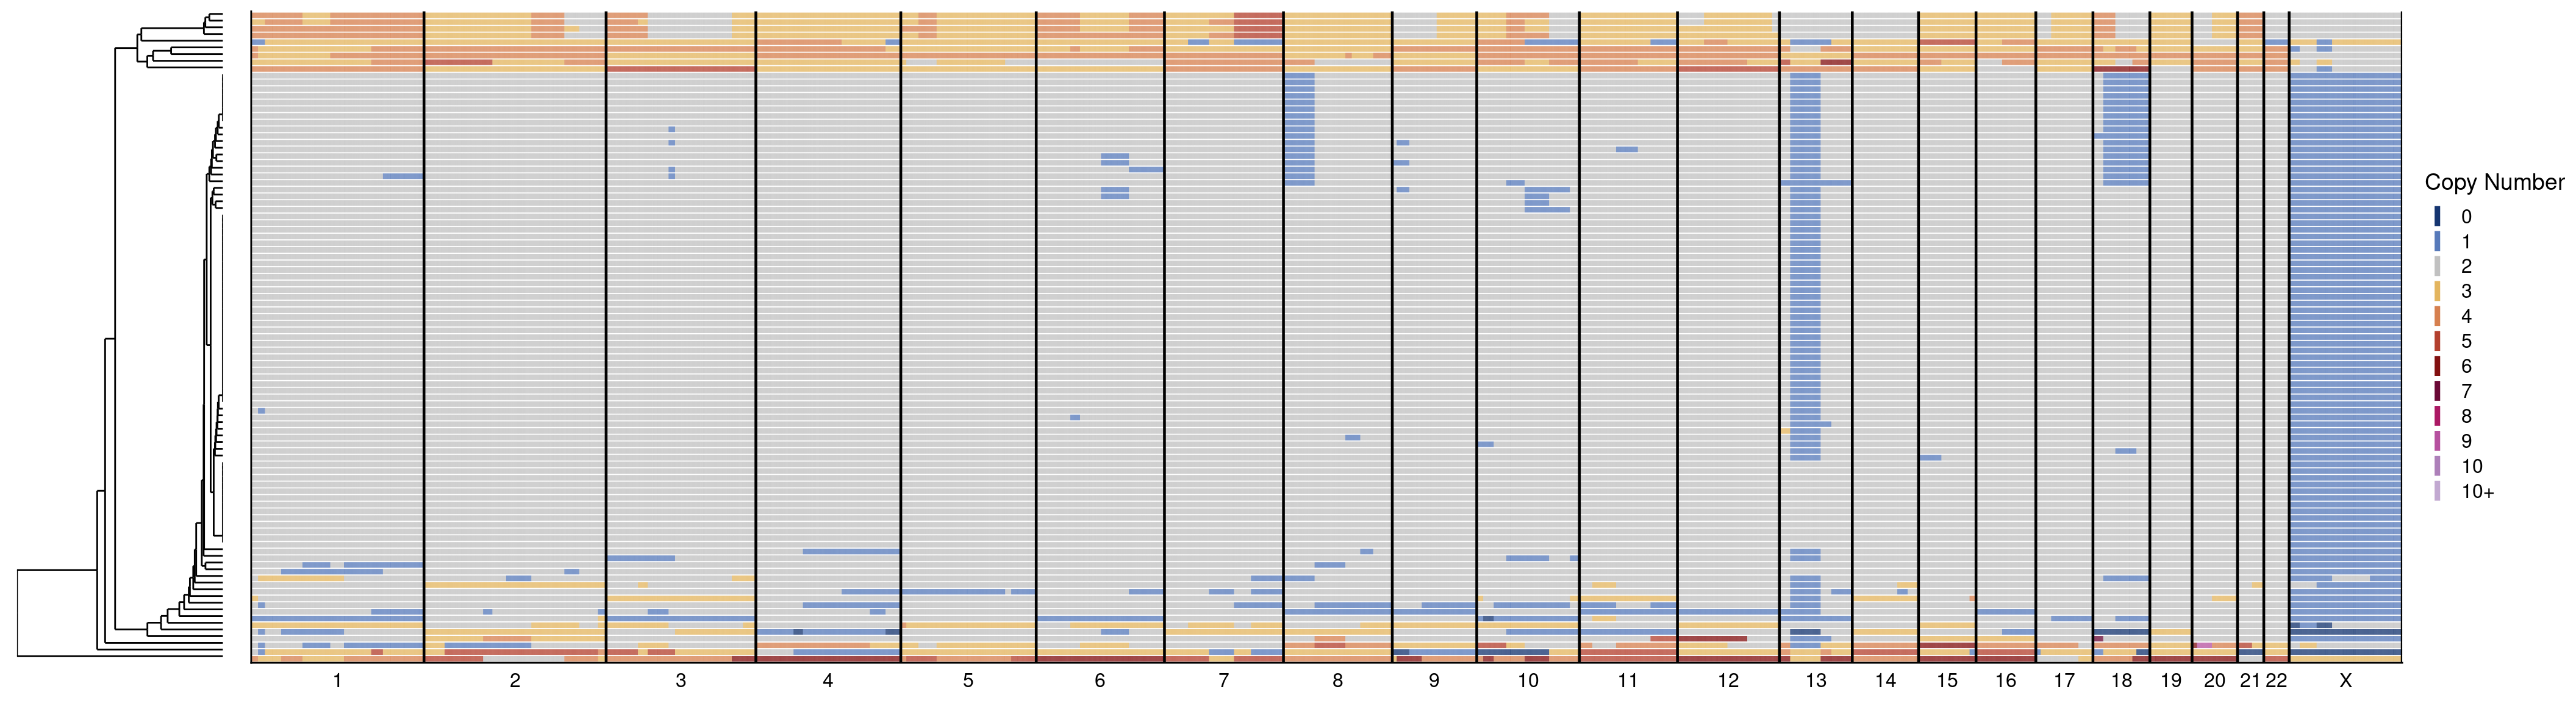
The analysis and figures based on the microscopy is unfortunately not included in this markdown.