13 Phylogenetic analysis of breast cancer
This sections produces all the figures used in Supplementary Figure 10.
# Source setup file
source("./functions/setup.R")

# Load functions
source("./functions/plotHeatmap.R")
13.1 Performing phylogenetic analysis
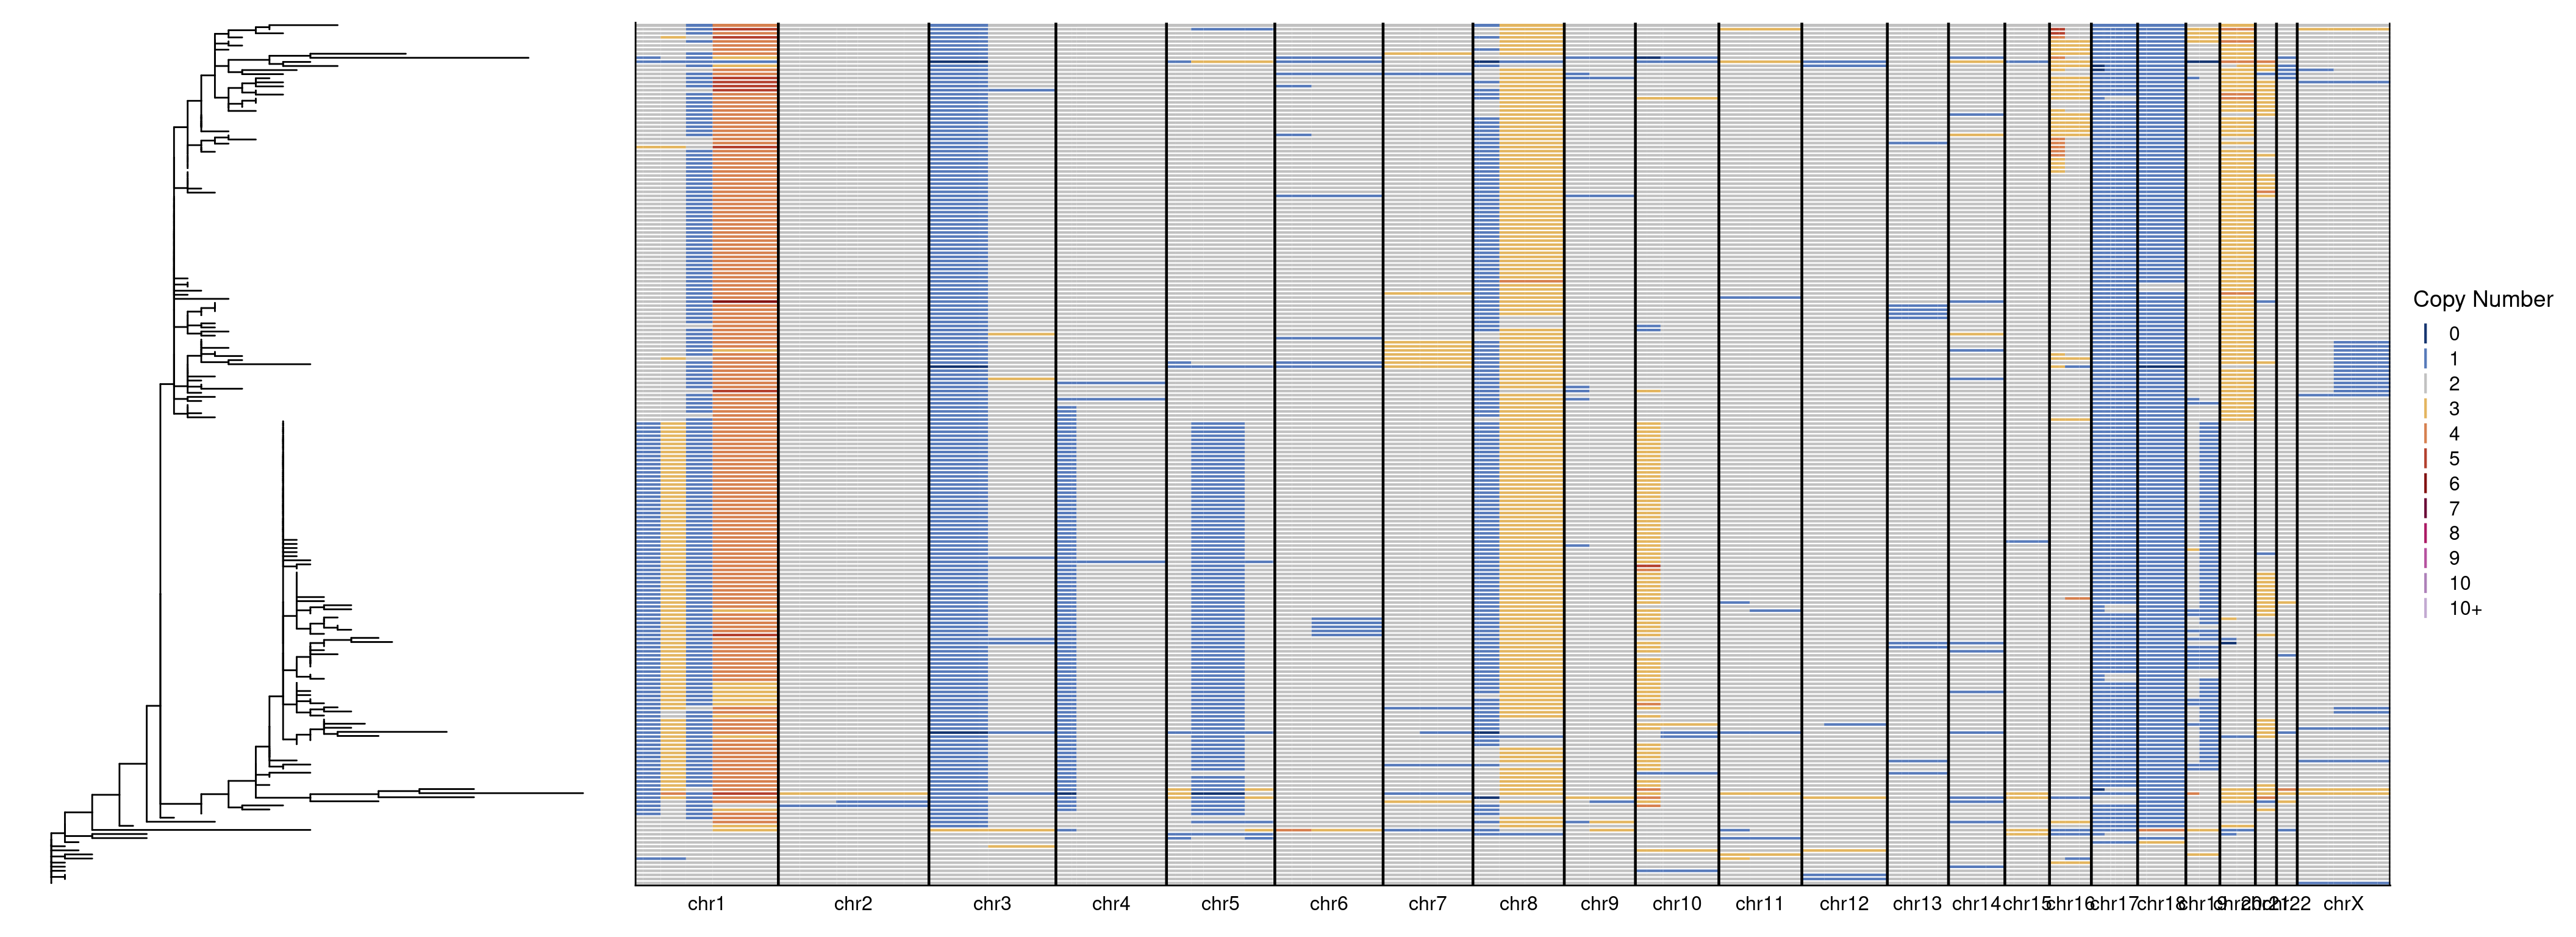
We performed phylogenetic analysis of the single-cells of two breast cancer samples using MEDICC2. The input for this the total copy number profiles and the following command was used to run this.
13.2 Plotting phylogenetic tree and heatmap
We then plot the tree generated by MEDICC2 alongside the single-cell genomewide heatmap. First we plot sample 1.
# Load in brca1 data
tree = read.tree("./data/phylotrees/brca1_500kb.new")
input = fread("./data/phylotrees/brca1_input.tsv")

# Reorder
dt = dcast(input, chrom + start + end ~ sample_id)
dt = dt[gtools::mixedorder(chrom),]

# Rename column and set chr23 back to chrX
setnames(dt, "chrom", "chr")
dt[chr == "chr23", chr := "chrX"]

# include diploid
dt[, diploid := 2L]
dt[chr == "chrX", diploid := 1L]

# Plot tree
tree_plot = ggtree(tree)

# Get sample order from tree
col_order = rev(get_taxa_name(tree_plot))

# Plot heatmap
heatmap = plotHeatmap(dt[, 4:ncol(dt)], dt[, 1:3], dendrogram = F, order = col_order, linesize = .75)

# Combine plots
tree_plot + heatmap + plot_layout(widths = c(1, 3))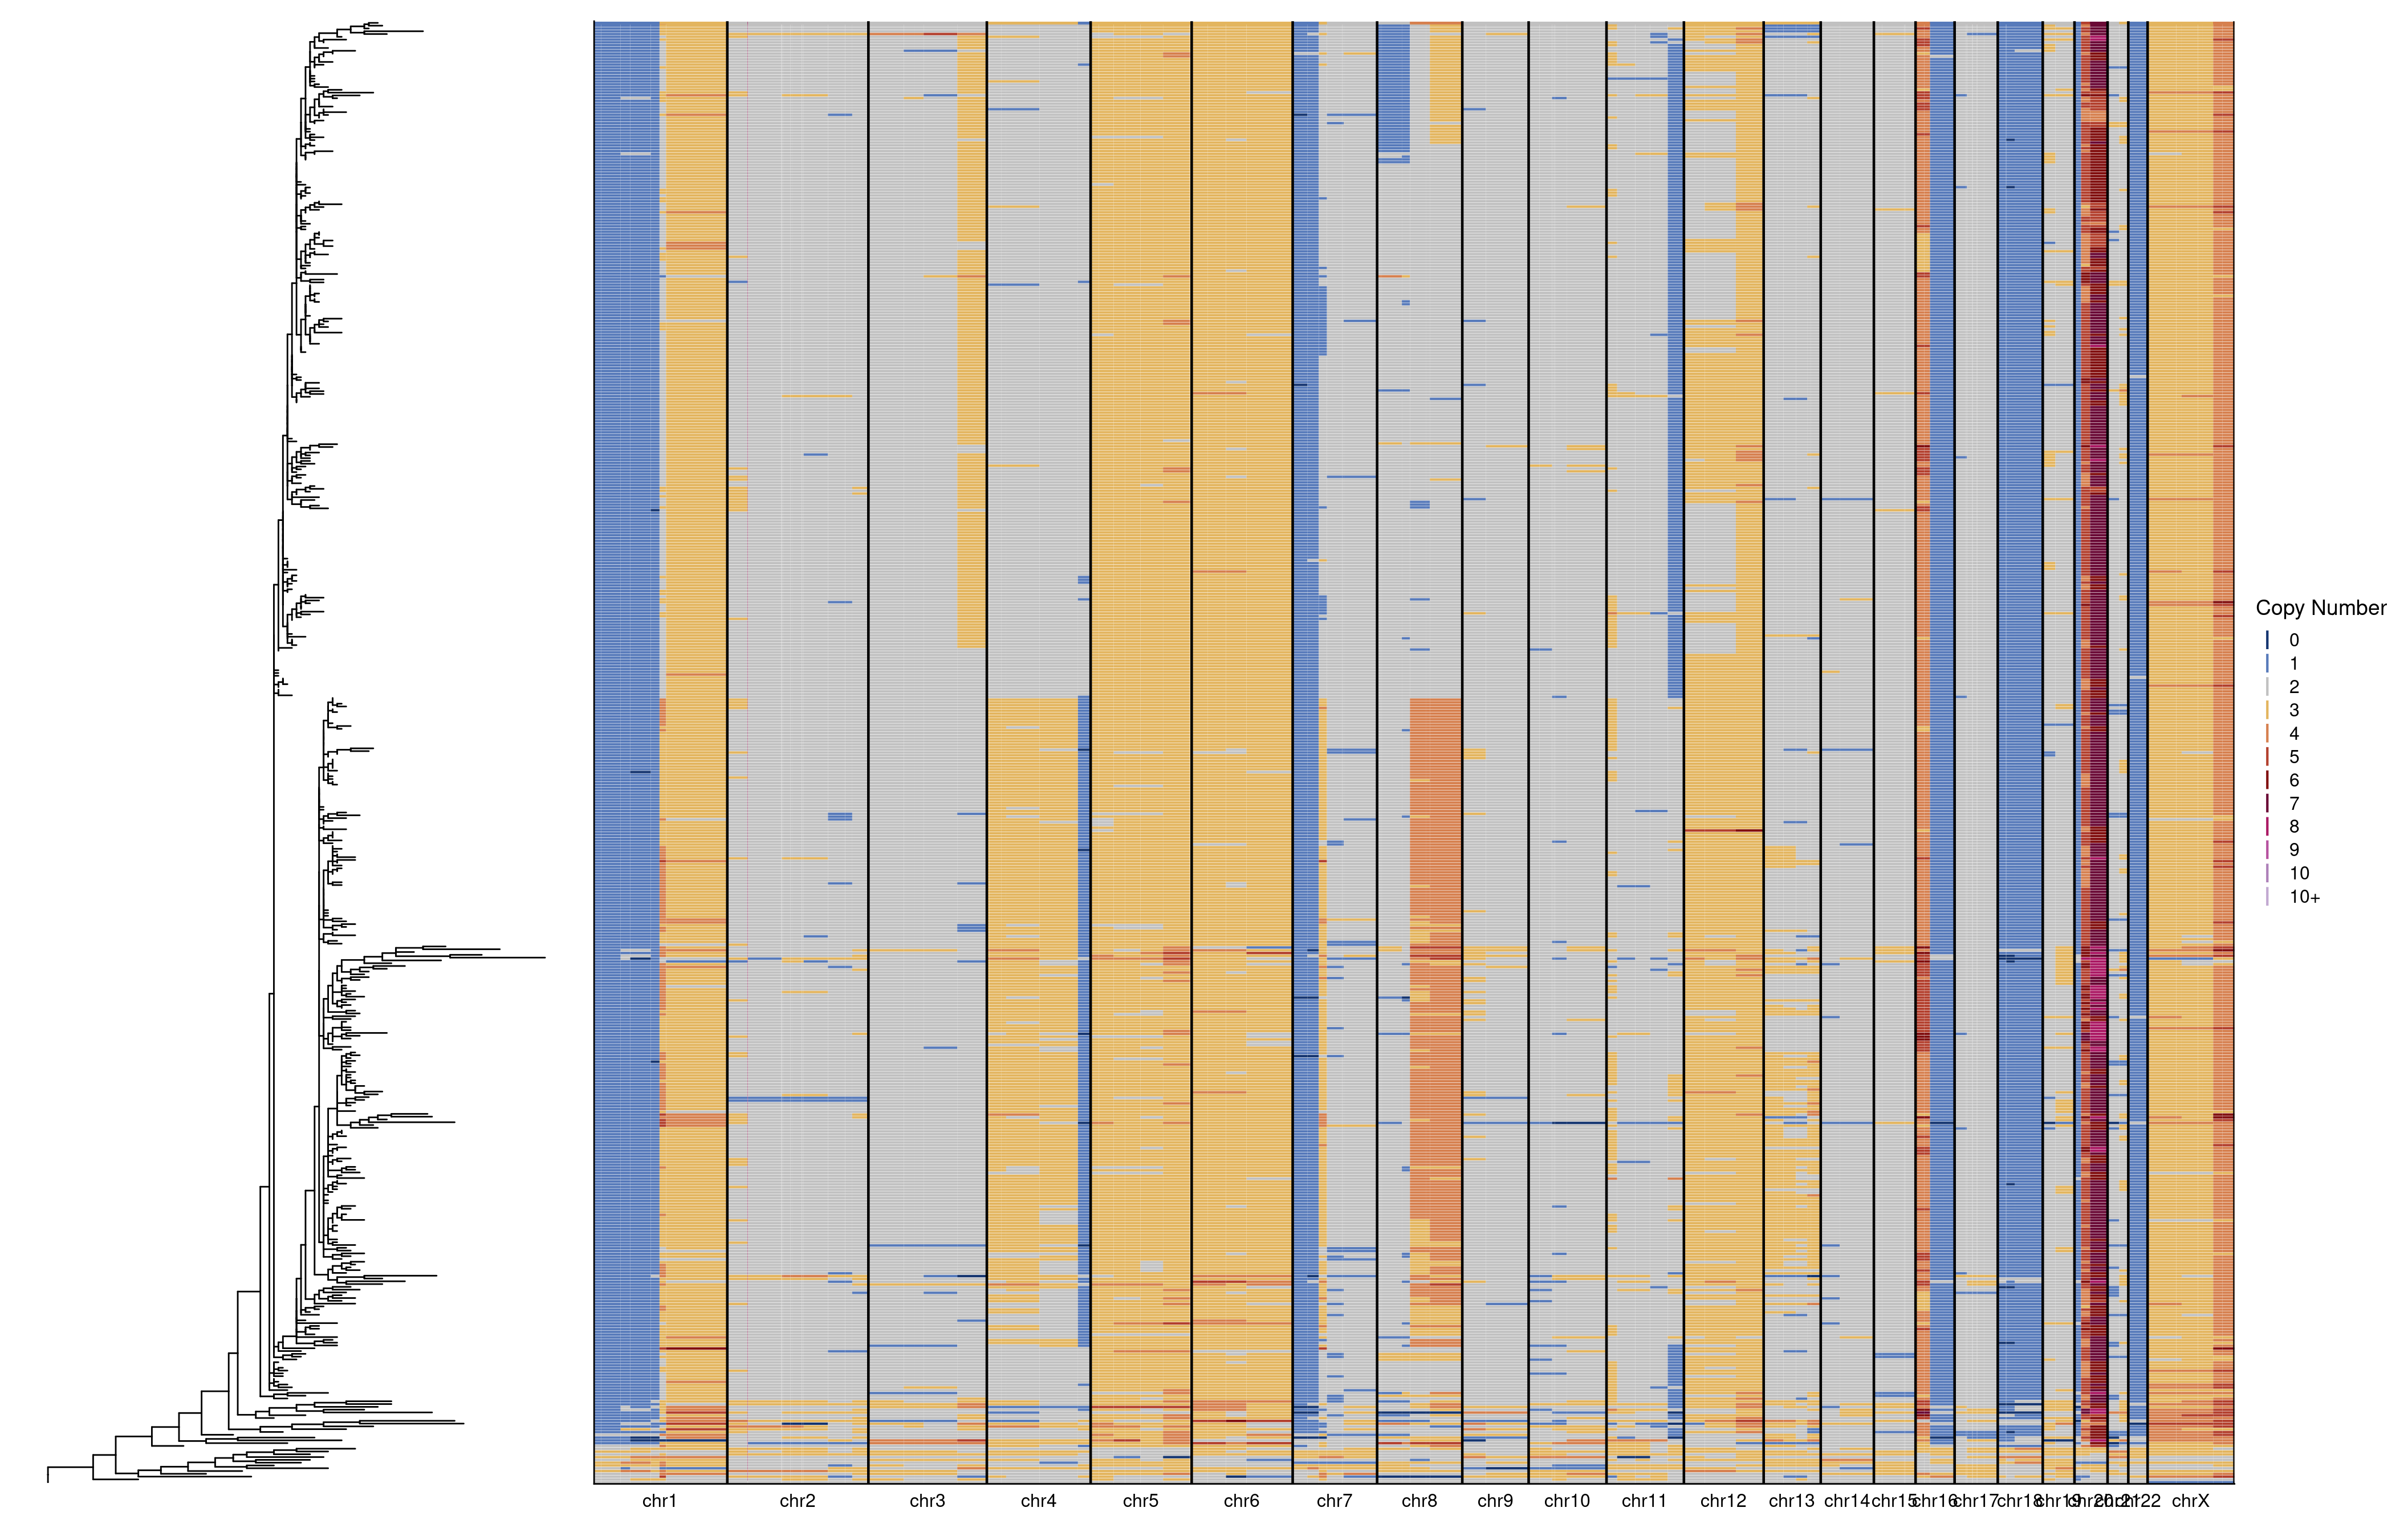
Next, we do the same but for sample 2.
# Load in brca1 data
tree = read.tree("./data/phylotrees/brca2_500kb.new")
input = fread("./data/phylotrees/brca2_input.tsv")

# Reorder
dt = dcast(input, chrom + start + end ~ sample_id)
dt = dt[gtools::mixedorder(chrom),]

# Rename column and set chr23 back to chrX
setnames(dt, "chrom", "chr")
dt[chr == "chr23", chr := "chrX"]

# include diploid
dt[, diploid := 2L]
dt[chr == "chrX", diploid := 1L]

# Plot tree
tree_plot = ggtree(tree)

# Get sample order from tree
col_order = rev(get_taxa_name(tree_plot))

# Plot heatmap
heatmap = plotHeatmap(dt[, 4:ncol(dt)], dt[, 1:3], dendrogram = F, order = col_order, linesize = .75)

# Combine plots
tree_plot + heatmap + plot_layout(widths = c(1, 3))